Note: while the examples presented in this article are all from the German-speaking world, the essential aspects should be easily understood through the descriptive text.
Whereas in earlier times it was quite tedious to keep an eye on the market, what was going on in the market and the competitors, today completely new possibilities are opening up, which take particular account of the highly dynamic nature of the markets. With these new tools, marketing now has easier and faster ways to analyze and understand the desires, goals and needs of the respective target group(s) in a much better and more granular way. Thus, actions and campaigns can be planned and implemented with precision in a way that was hardly known before.
While in the past it was necessary to read a lot of printed material, surf many individual websites, conduct time-consuming surveys, and evaluate and merge various analysis tools, the rapid technical developments of recent years have created completely new opportunities. Today, it is much easier to access an enormous data pool that is available at any time and that describes and maps the behavior of target groups in great detail.
Because basically a large part of what is needed to assess current market events is available. All this information is collected and bundled via search engines, first and foremost Google. It is hardly an exaggeration to say that Google conducts a quasi permanent user survey. In this way, it is possible to link elegantly and in a fairly simple way the information provided (web pages) on the one hand, i.e. the supply, and the actual use of this information by the users on the other, i.e. the demand.
Use of Search Engine Data
It is precisely through the reactions of users to the content offered that Google can assess its relevance and thus create the familiar hierarchical index, which ideally displays the exact right content for each search query submitted. By linking the users’ queries with the, in principle global, content pool, an impression of practically all conceivable markets is automatically created – and almost in real time. We thus have permanent market monitoring by Google, which provides an enormous amount of valuable data, information and insights.
For example, the activities of the competition can be observed (how is the competition positioning itself, what is its focus, have there been changes in the product or service range, which information/offers are accepted by users and – particularly interesting – which are not, and much more).
This enormous amount of data is therefore right in front of our eyes, at any time, always highly up-to-date – and free of charge, too. But how can this treasure trove of data be exploited? By using suitable tools (some of which are freely available), which I would like to discuss in the following.
Although most of the approaches and tools described here were developed in the context of search engine optimization (SEO), they can be applied to any type of marketing communication, whether it’s website design, email campaigns, or event or trade show design, because after all, it’s always about the right content for the right target audience.
Basic Data
“Content is King” – that reads like a long-worn buzzword. And yet it is truer than ever. Not only is it important to tailor communication to the needs and interests of the target group, but individual words, terms or phrases can make the difference between content that is well received – or ignored.
So it’s worth investing a little time in and playing with alternative terms and spellings. But how can you find out which terms are more suitable? Google Trends is an excellent tool for this (https://trends.google.com). Here is an example from the area of electromobility (history over 90 days, searches from Germany):
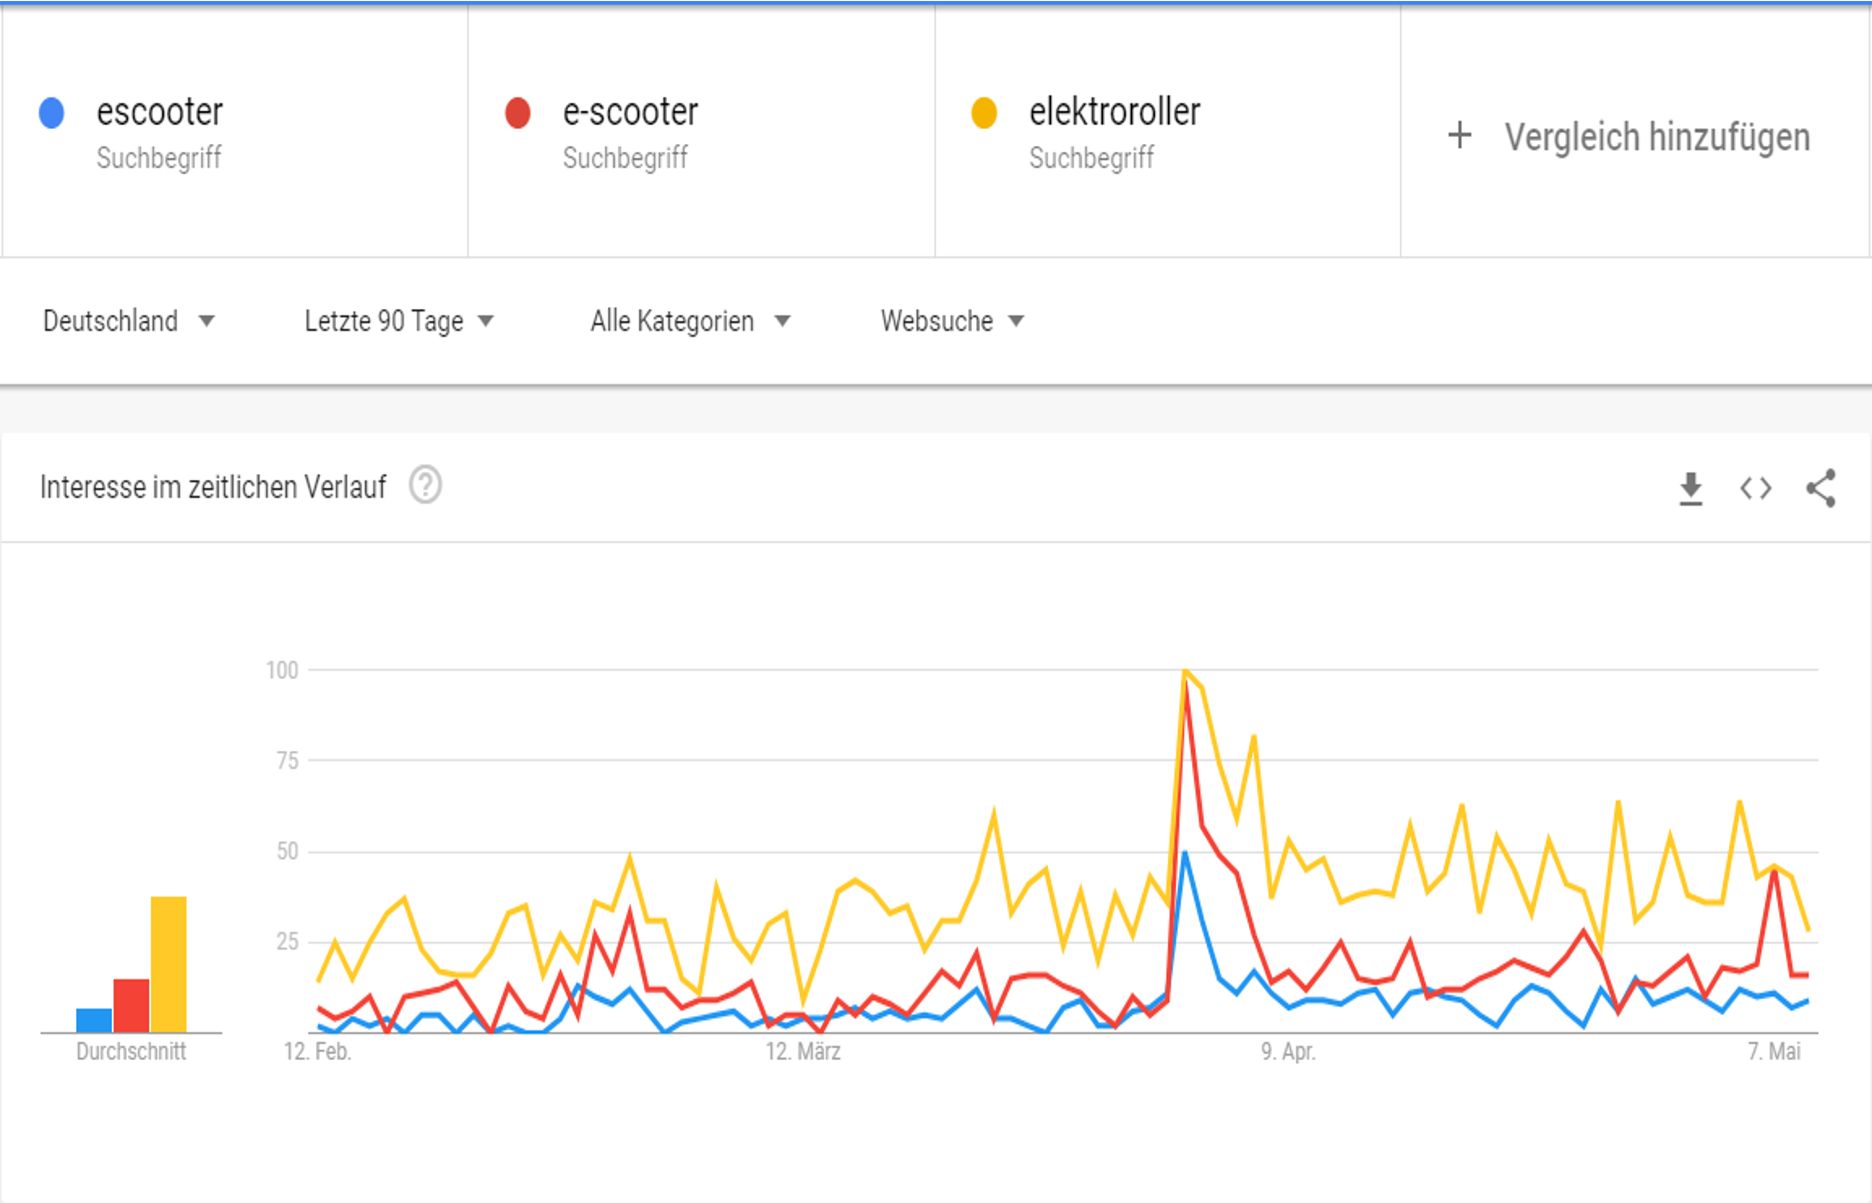
Google Trends is excellent for determining fluctuations in interest over time, on the one hand, and for comparing alternative terms or spellings, as in the example chosen here, on the other. So what can be learned from this? First, that the spelling of a term can indeed be significant. The search volume for “e-scooter” is almost always higher than for “escooter”. It is interesting to note that in the context of “electrically powered two-wheelers”, which is relevant here, the term “elektroroller” (electric scooter) is searched for significantly more often.
Also of significance is the peak in demand at the beginning of April 2019, which coincides with the emerging (political) discussion on the approval of electric scooters. As can be seen clearly, interest thereafter remained at a higher level on average than before.
It is therefore worthwhile to use Google Trends already during content planning. Especially to test different terms within the given marketing context for their potential.
Another possible use for Google Trends is to look at interest over a shorter time frame, such as a week or even just a day. This is particularly interesting for email campaigns, for example. Here we should look at whether there are peaks in demand for the advertised term/context. The example of “Autowerkstatt” (car repair shop) is a good way to demonstrate this:
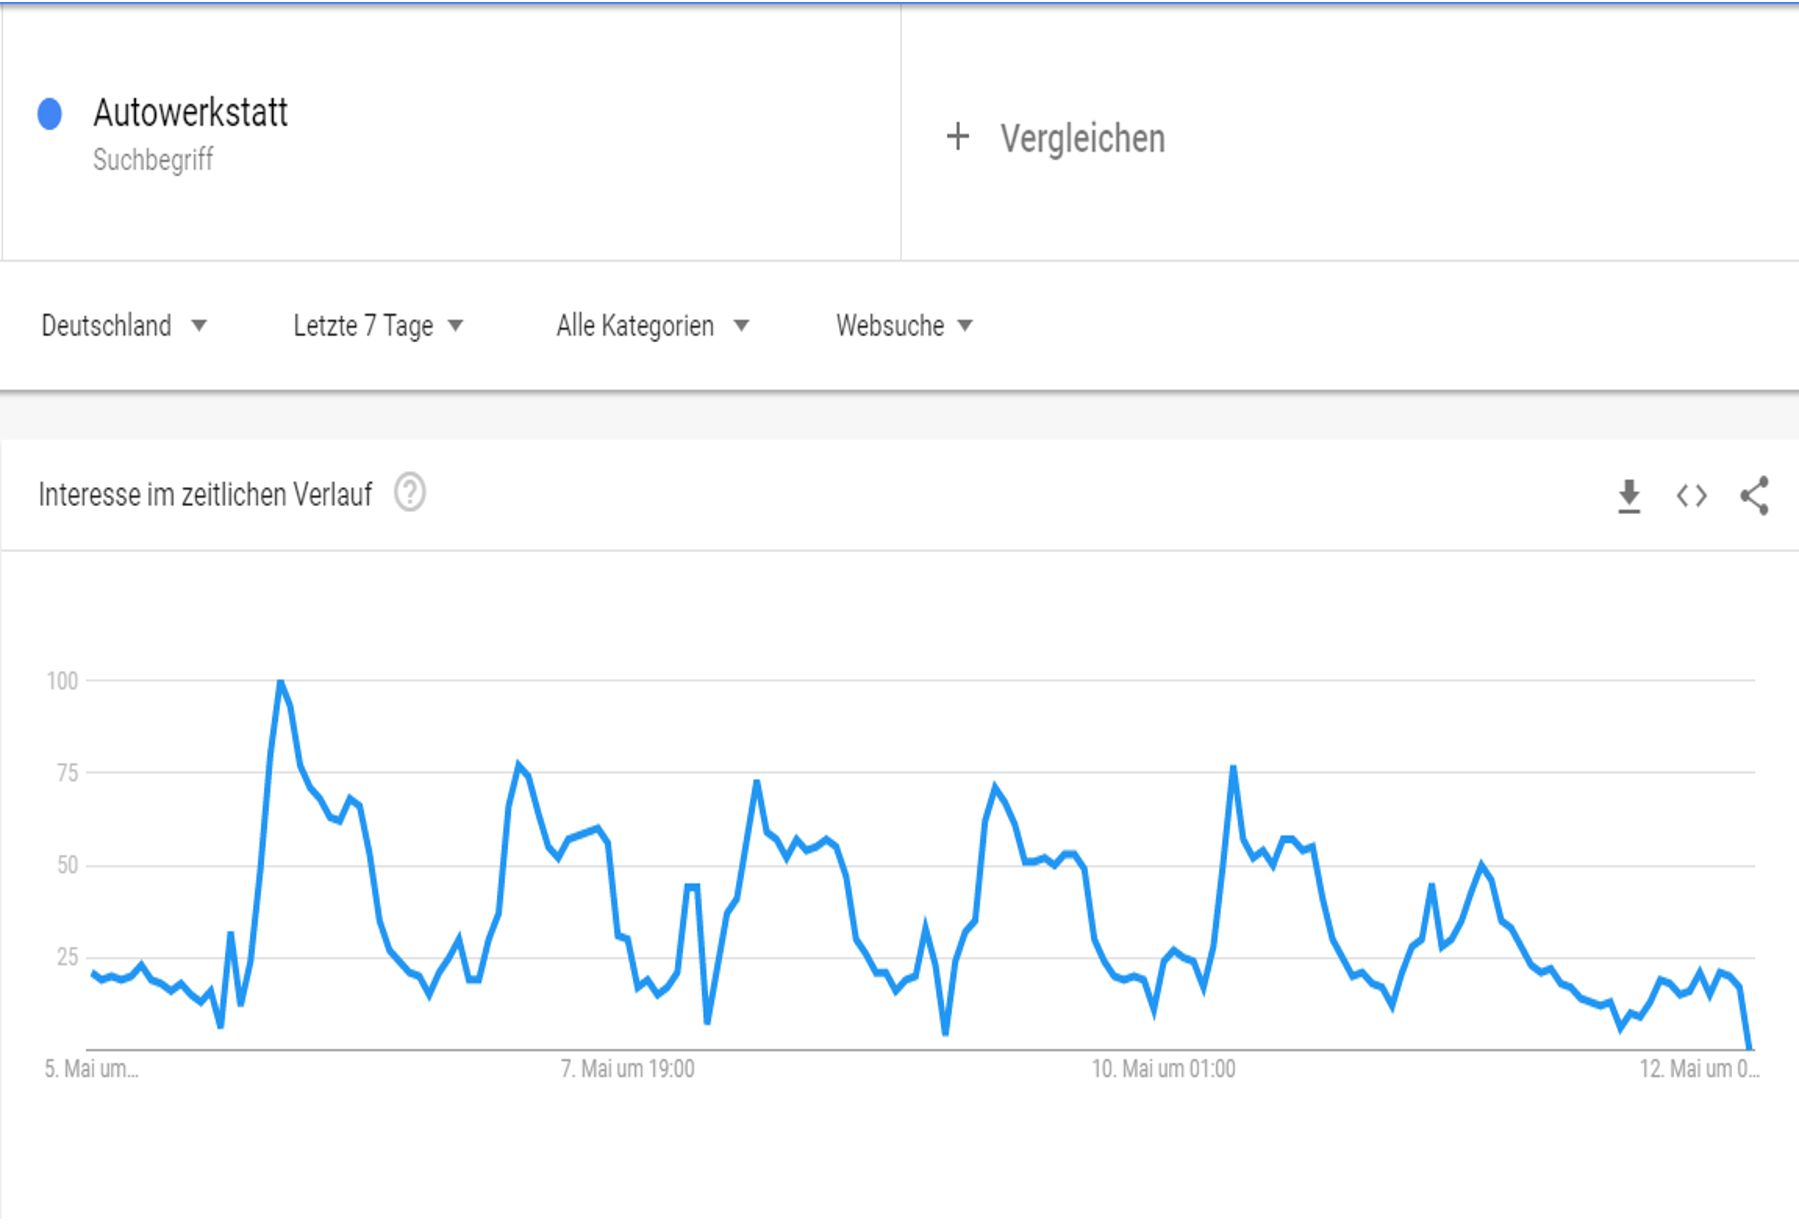
It can be assumed that the (general) search for “auto repair shop” is submitted for two main reasons: to make an appointment for a repair shop or with the intention of buying a new or used car. Two peaks of demand become clear: in the morning at 8 am and in the afternoon around 3/4 pm. The day with the highest demand is Monday. By the way: the demand curve seen here is quite typical for the B2C area, in the B2B environment completely different patterns can emerge.
A campaign or action that is intended to promote services related to “car dealers” can thus be targeted accordingly: E-mails, for example, should reach recipients’ inboxes shortly before peak demand times in order to make the most of the high level of interest in the topic at that time.
But these time sequences are also important for the publication of new or modified content on websites (such as promotions). Here, too, the live posting of new and interesting content should be adapted to the reading habits and times of the target group.
Trend Assessment
Another area of application for Google Trends is – as the name suggests – the assessment of demand trends. For such an analysis, one should always look at longer periods of time (even if it may make sense to look at shorter periods of time in individual cases). Of interest is whether there is a clear trend for specific topics and/or terms and/or phrases. In other words: either increasing or decreasing demand.
I would like to demonstrate what this can look like using the meta topic of “sustainability”. To do this, let’s look at the trend over the last five years (in the UK). We would probably expect interest in this topic to have increased over the last five years. And indeed, that is the case. As the trend line (drawn by me, red, linear) illustrates, interest is increasing relatively slowly but steadily.
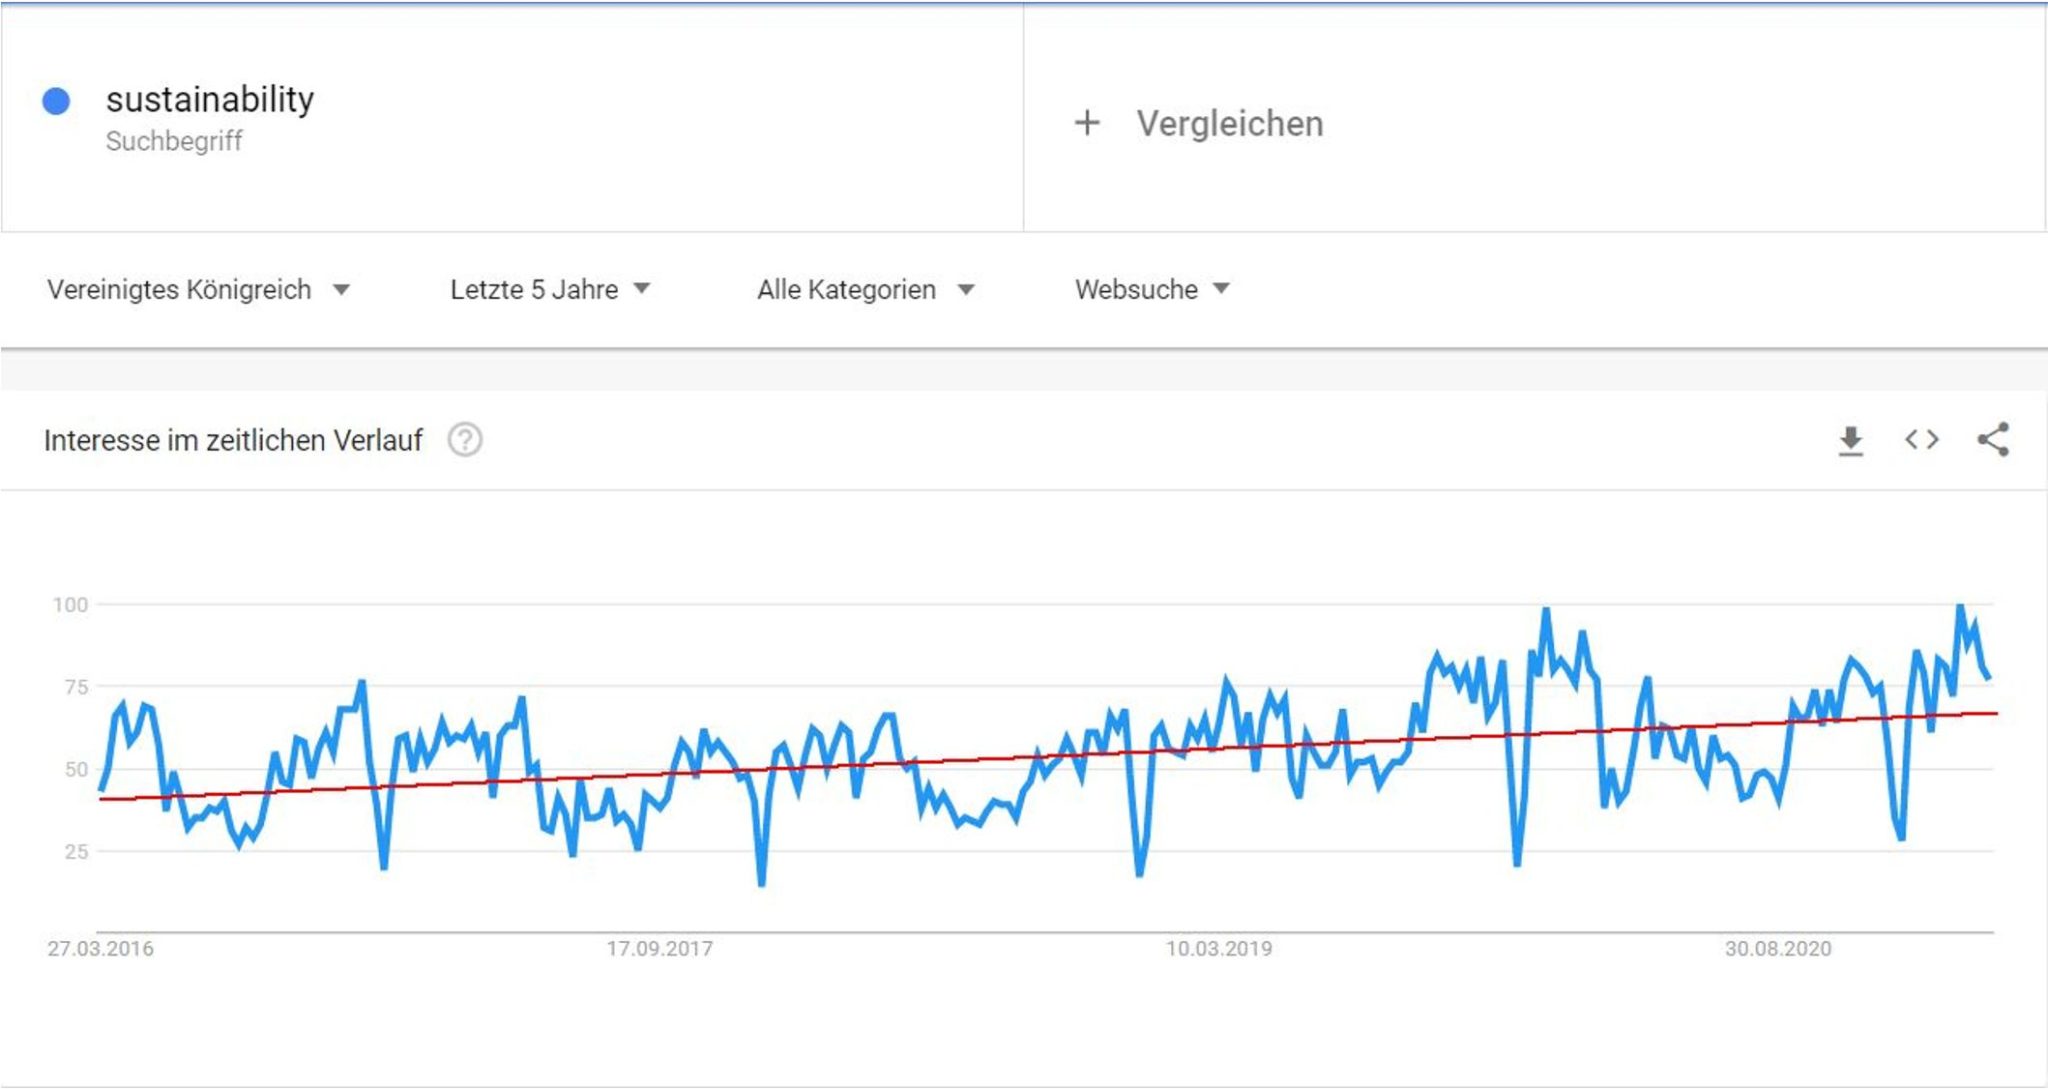
Monitoring such trends for the most important topics and terms can therefore provide important data for deciding where marketing investments or even investments in products or services should be directed. The prerequisite for this, however, is that this observation is carried out continuously and is an integral, central component of (data-driven) marketing.
By the way, it’s always worth taking a look at the terms listed below the graphic in the “Related Topics” and “Related Queries” blocks. These list terms and phrases that were searched for in connection with the meta topic. These therefore essentially “drive” demand. In the present case, the most important drivers come from the contexts of “environment” and “finance”.
Advanced Analytical Methods
So far, we have only accessed a small part of the available data. However, in order to lift the entire treasure trove of data and, in particular, to identify potential problems, we need specialized tools such as RankAnalyst (https://rankanalyst.com). I would like to briefly illustrate what is possible with this using a real example.
It is a small but fine store that specializes in the sale of special gift packaging. It was noticeable that the store did not appear on the first two search results pages with many topics/terms. This was especially true for posts from the blog. The ranking trends can be seen in the following graphic:
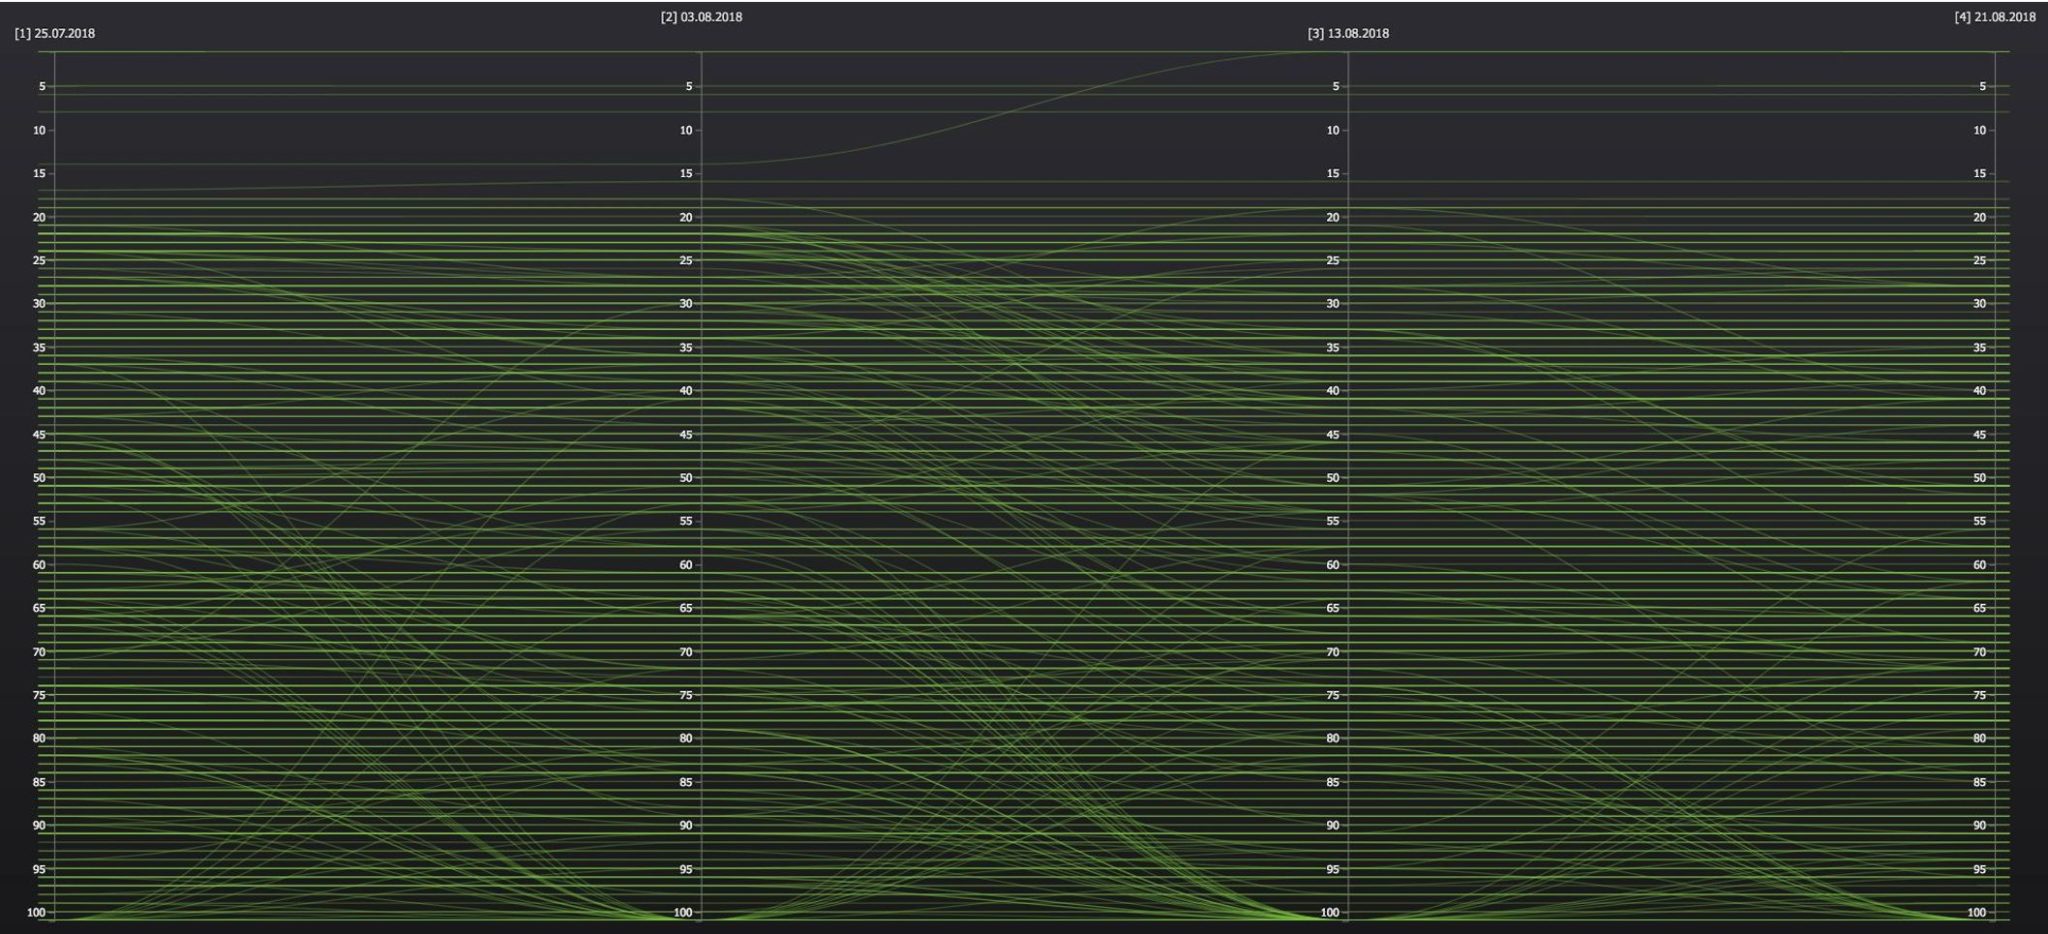
So why was this particular content so categorically devalued? Although (according to analytical data) the number of hits was quite high, i.e. the interest was definitely there? Apparently, there was a barrier around rank 20 that could not be crossed.
A closer look revealed that these articles were too far away from the home page. Other content that was linked directly from the home page was able to achieve better rankings. This results in a simple fix: the pages in question should be linked directly from the home page. This would turn “2nd page” pages into “first page” pages.
Ranking data reveals an enormous amount about the behavior of the target group and, above all, about whether this target group is optimally addressed or not – and, above all, which provider serves the demand better. In addition to the fairly simple case described above, RankAnalyst can be used to perform very comprehensive analyses, especially with regard to market trends, target group analyses, competition analyses or content quality.
Conclusion
It is therefore worthwhile to use these readily available data sources at the very beginning of planning a campaign or action, and even more so to check its effectiveness. And especially when it comes to strategic considerations. Test it yourself! There are no limits except your imagination, and except for your time, there is no cost to you with most tools. If you encounter more persistent problems or the behavior of your target group is a mystery to you, then you should resort to specialized tools like RankAnalyst and experienced experts.
Der gebürtige Augsburger, Jahrgang 1965, war in seiner beruflichen Karriere im Marketing der ganz großen, zuletzt bei Symantec, für den Aufbau neuer Märkte zuständig. 2014 gründete er Optimizing Experts und begleitete seitdem die Entwicklung von Online-Strategien. Er ist erfolgreicher Buchautor, Speaker und Mitentwickler der Schwarmanalyse, eine Digital Behave-Kernkomponente.

