Note: while the examples presented in this article are all from the German-speaking world, the essential aspects should be easily understood through the descriptive text.

The question of “what does the consumer want?” is probably as old as business itself. In the age of almost unlimited purchasing and procurement options, both online and offline, the question is more urgent than ever: does my offer meet the demand (well enough)? Or are there differences or even entire areas of demand for which I am not visible as a supplier, although I could serve them?

In addition to the usual market research tools (such as surveys or panels), there is another, more cost-effective approach in today’s highly digitized world, which we would like to present today.

Google has long since ceased to be (only) concerned with offering a website that is as technically “clean” as possible. Google now decides on the order of search results based on user acceptance. So what does “user acceptance” mean? Basically nothing more than: how is a specific offer (of a product or service) seen, evaluated and accepted (or rejected)? Consequently: how high is the coverage between my offer and the demand, i.e. how much can I meet the expectations and wishes of the users (and potential customers)?

Google sees itself and works as a “moderator”, and therefore always strives to match the behavior of its users. In other words, Google tries to provide the most suitable answer possible to a user’s search/question. In other words: to achieve the highest possible coverage of supply and demand. Through this role as moderator, many aspects about the expectation and acceptance of specific target groups can be uncovered, and not only statically, but also over time: does the expectation and/or acceptance change? If so, in which direction? How should I react to this?

In the following, we will demonstrate this approach with an example. To do this, we will look at the offers (their websites) of six car repair shop portals, or chains (Autoreparaturen, Bosch Car Service, Fairgarage, Pitstop , Repareo and Vergoelst). The goal of these portals is, of course, to persuade the user to make an appointment with a garage. But what expectations (demand) do users have along the way? And who best fulfills (offers) these expectations?

First of all, this raises the question: how can Google help us with this analysis? In order to be able to answer a user question as well as possible, Google looks at the available offers (the web pages), categorizes them thematically, sorts them contextually (here mainly cars, repairs) and finally arranges them in terms of user acceptance (which offer is better accepted by the users?). This is how the familiar page of search results is created. And these “rankings” provide far more information than is apparent at first glance.

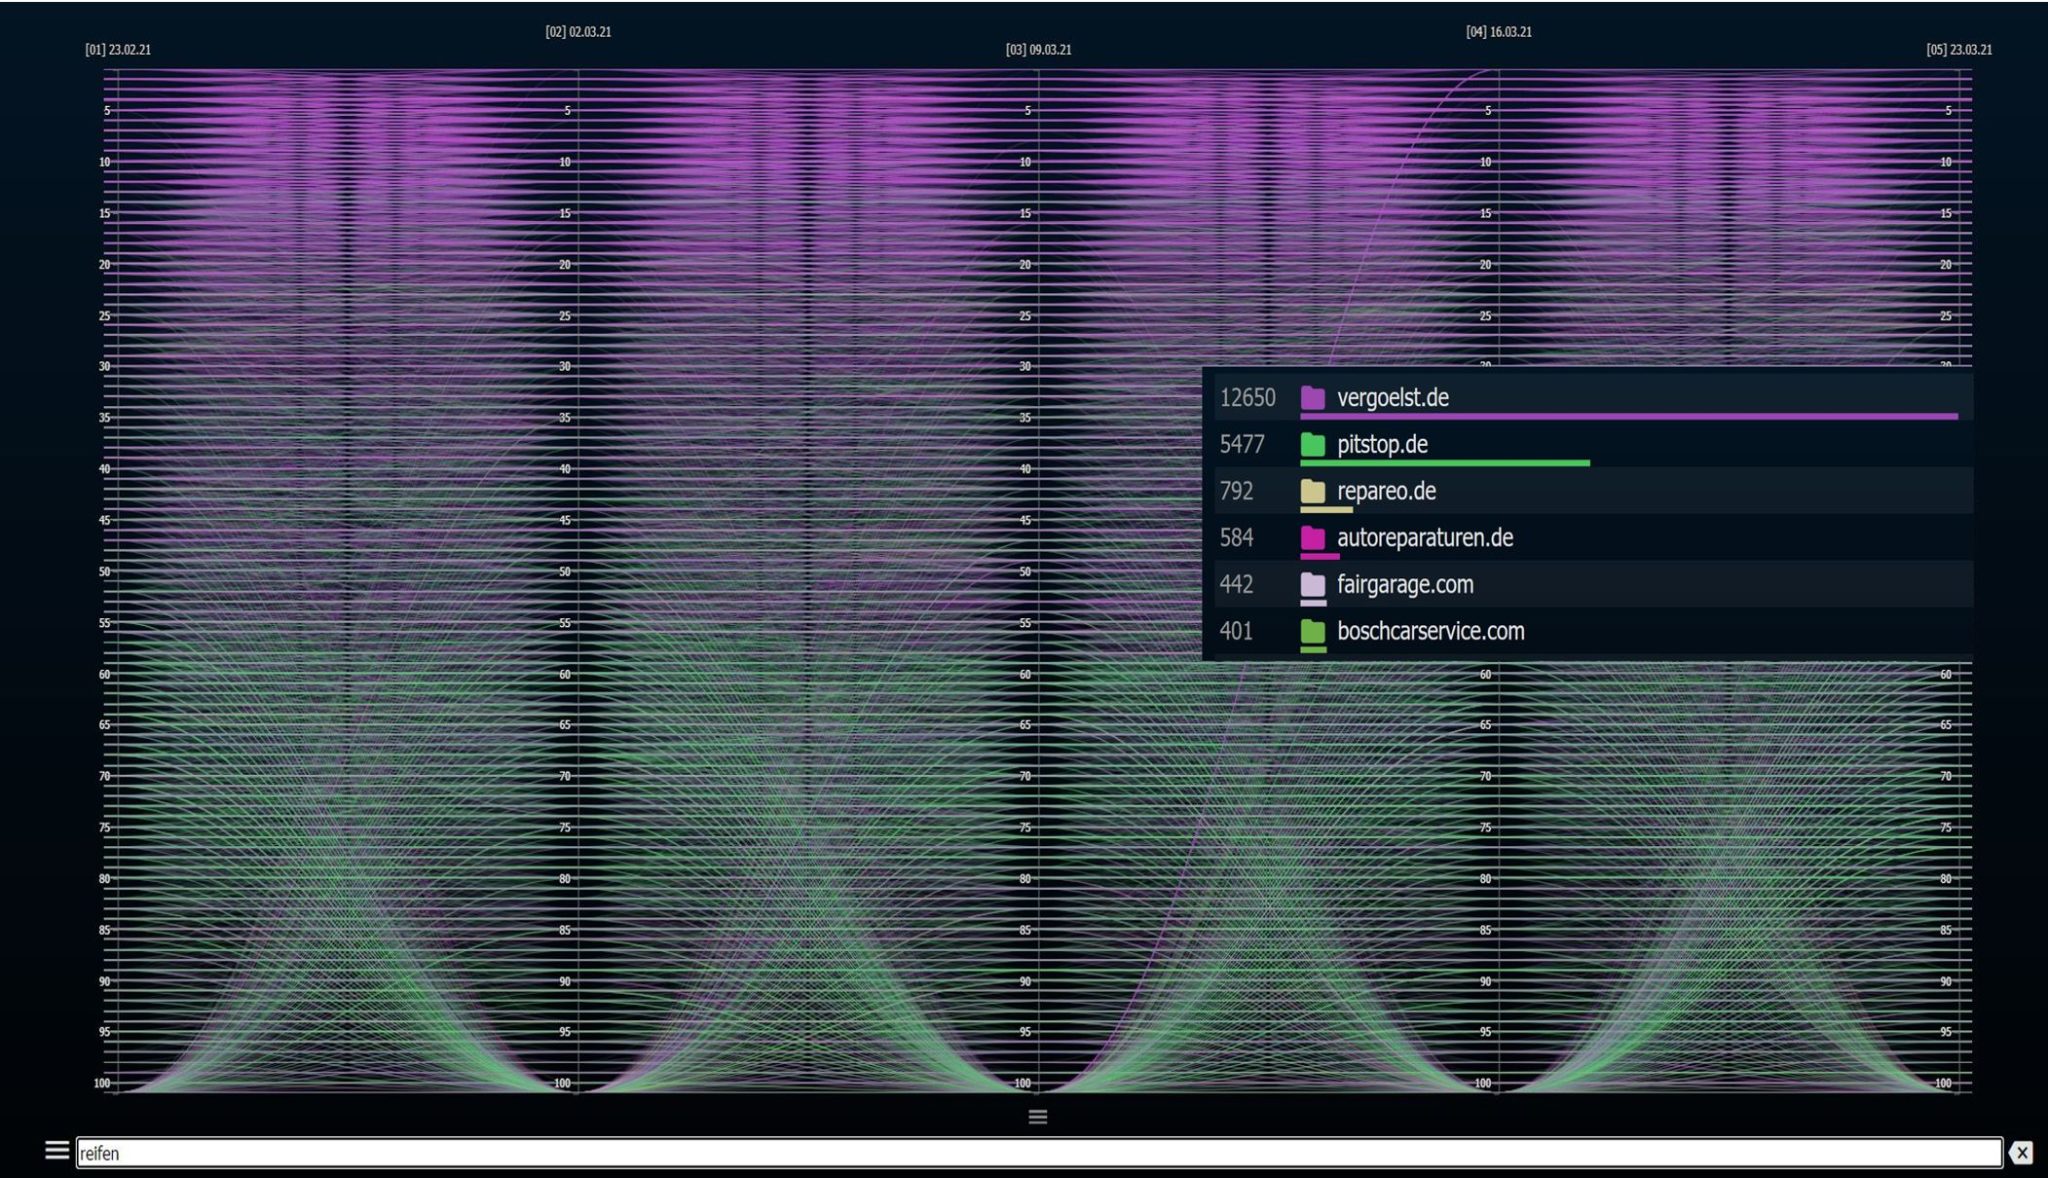
In our example, let’s start with the question of whether there are expectations in terms of brand loyalty. In the context of car repair shops, this brand loyalty does exist:

Source: rankanalyst.de

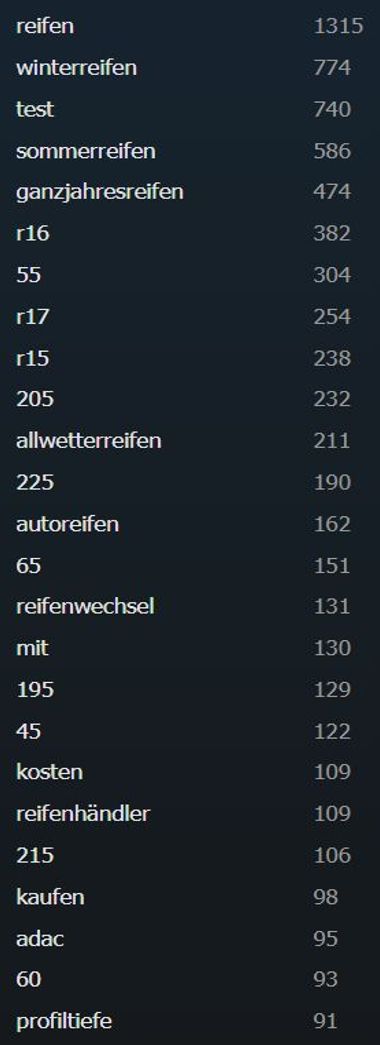
The graph shows all rankings (from 1 to 100, descending) over a period of 5 weeks (vertical axes) of the six websites considered. The market participants examined can be distinguished via different colors. On the one hand, we are interested in the volume (the number of “rankings”) and on the other hand, we are particularly interested in the high rankings, since these mean a high coverage of supply and demand. It is easy to see that the topic “reifen” (tires) is clearly associated with Vergoelst (see number of rankings), while the other providers have a hard time getting through to users with their offers. A look at the terms and phrases (excerpt) for which Vergoelst is preferentially ranked by Google makes it clear what is in demand (the topic of tire dimensions is almost completely occupied by Vergoelst):

Source: rankanalyst.de

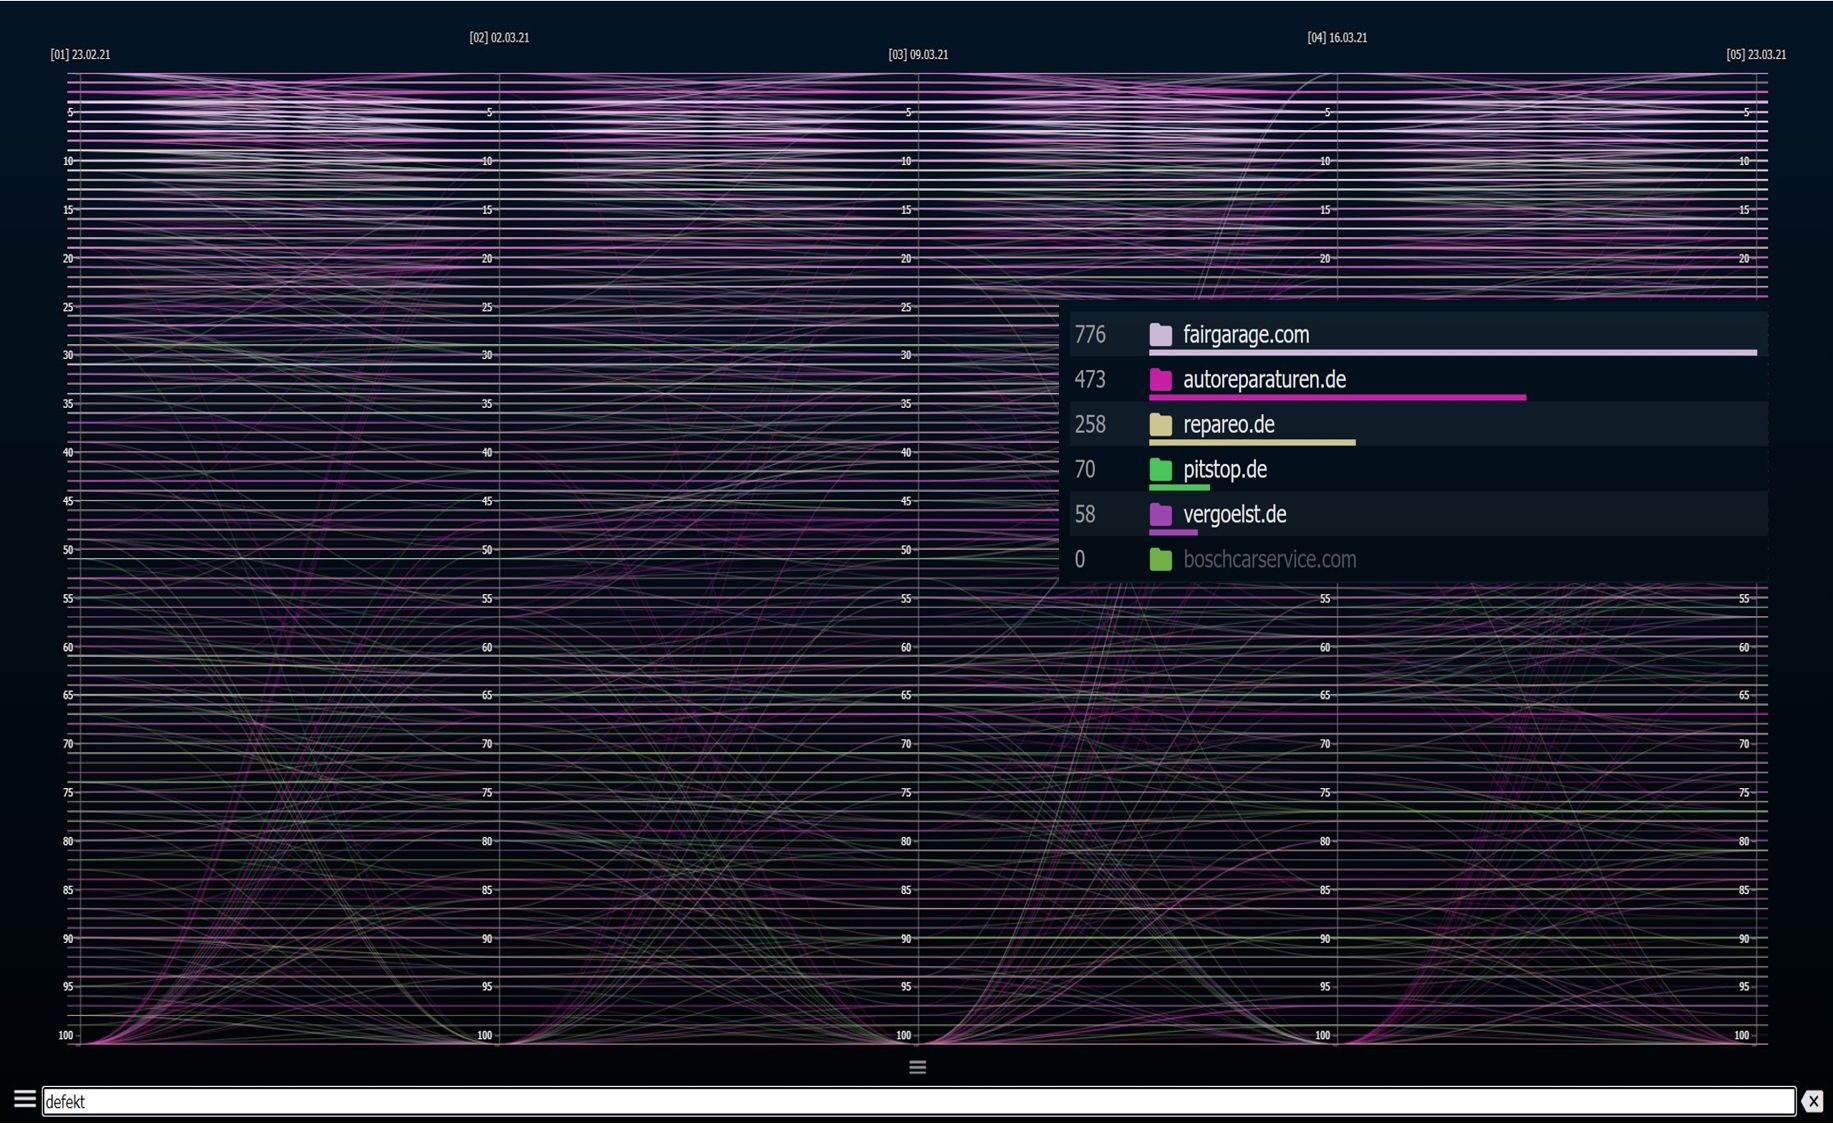
On the other hand, there should also be areas for which there is no brand loyalty. As can be seen here, this is actually rather the norm. This means that in such cases, strategically picking up a topic for a new market player is almost problem-free:

Source: rankanalyst.de

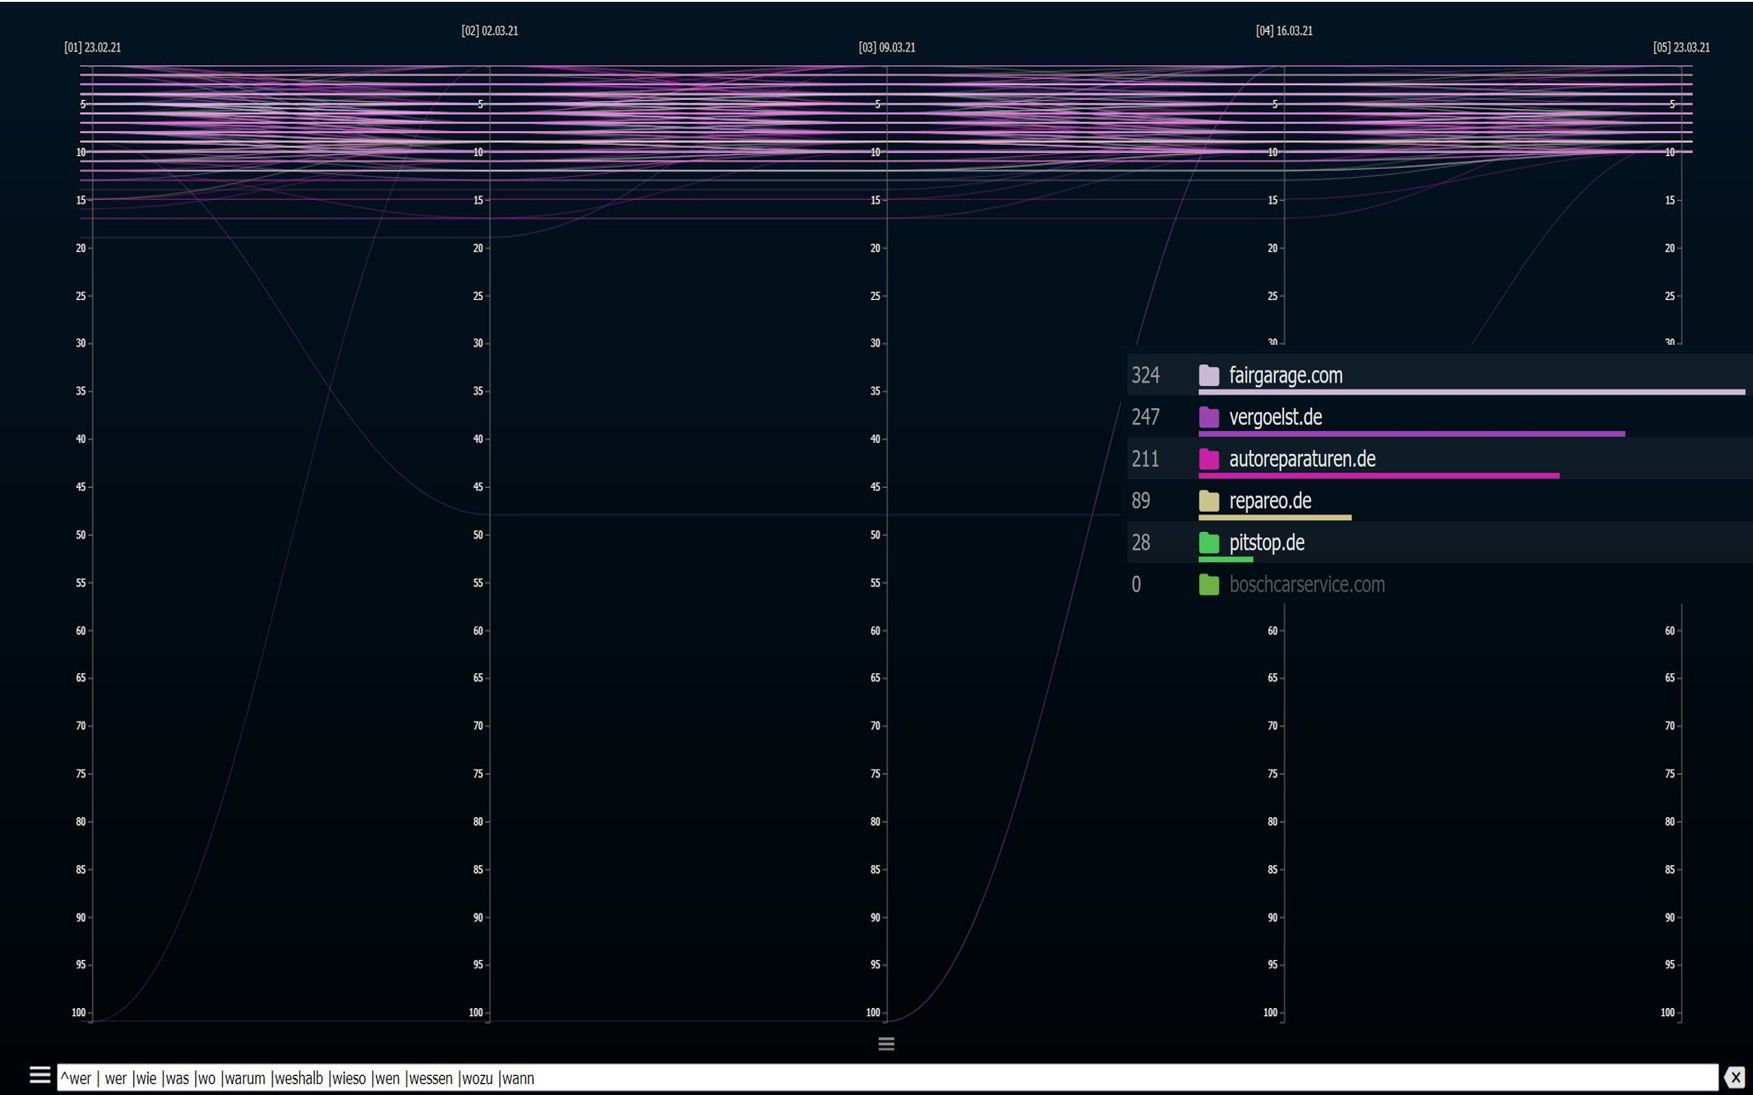
The topic “defekt” (defective) – on the car – does not show any brand loyalty (no surprise). Accordingly, a provider can position itself well here by analyzing demand and responding to it as precisely as possible. Fairgarage has obviously succeeded best in this, as a glance at the number of rankings in the chart makes clear. A look at the “W questions” (here only the top 10 rankings) reveals a key reason for this strong position:

Source: rankanalyst.de

A high proportion of the demand relates to questions such as: “how can I recognize a defect?”, “how serious is defect x?” or, of course, “what does repairing x cost?”. Fairgarage has obviously taken a very detailed look at what exactly users are asking for – and has tailored its own offering (almost) perfectly to this. This creates quite a clear dominance.

Review of Trends


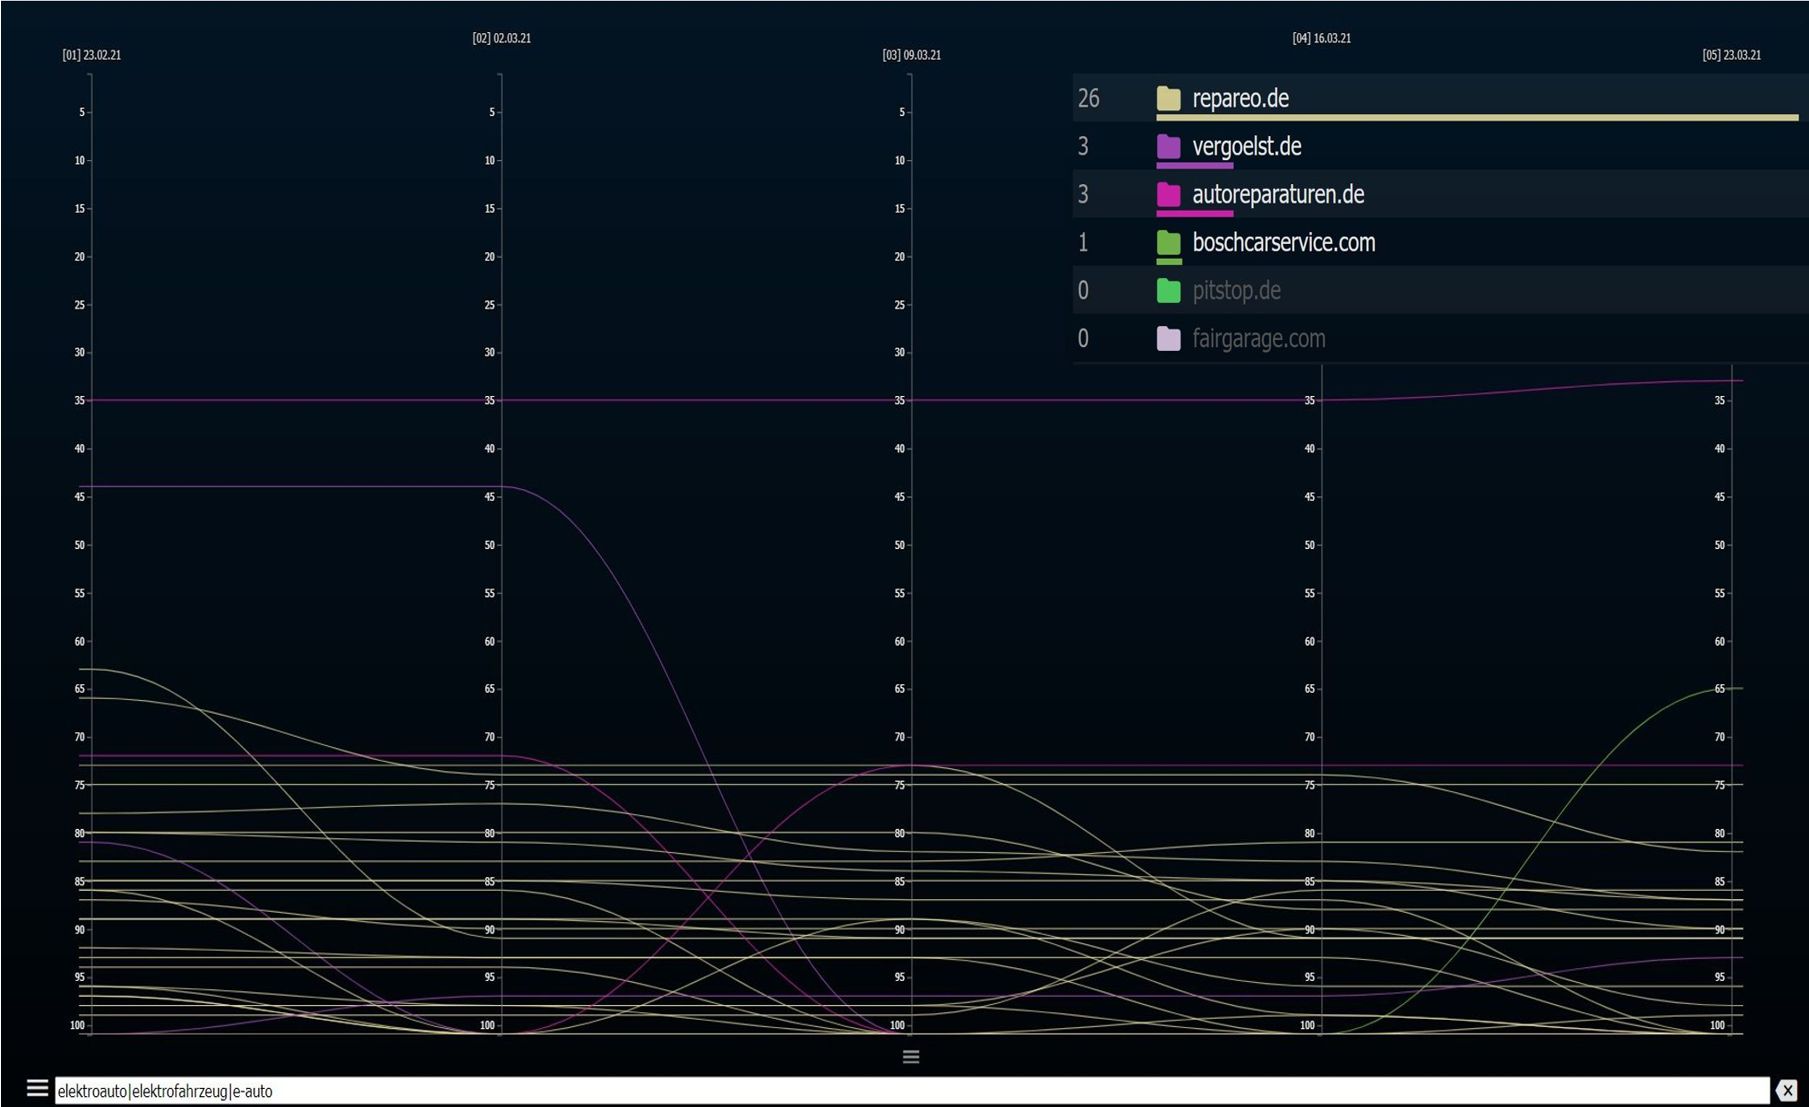
One of the most exciting – and probably also most central – questions in the context of market research is: am I as a provider (well enough) prepared for emerging trends? How could this question be tested? Let’s stay with the automotive repair shop portals and see how well they (can) respond to the rapidly increasing demand for “elektroauto” (electric cars):

Source: rankanalyst.de

Well, that is downright disastrous. The providers only manage 33 rankings, none in the top 10. This weakness becomes even clearer when we consider that all six providers achieve a total of just over 175,000 rankings. The share of rankings for “elektroauto” (electric car) is therefore just under 0.02%.
Has it at least been possible to increase this proportion, even if only minimally, within the last few months? No, quite the opposite. A look at data from October 2020 showed that of the 50 rankings achieved at that time, a third were actually lost.

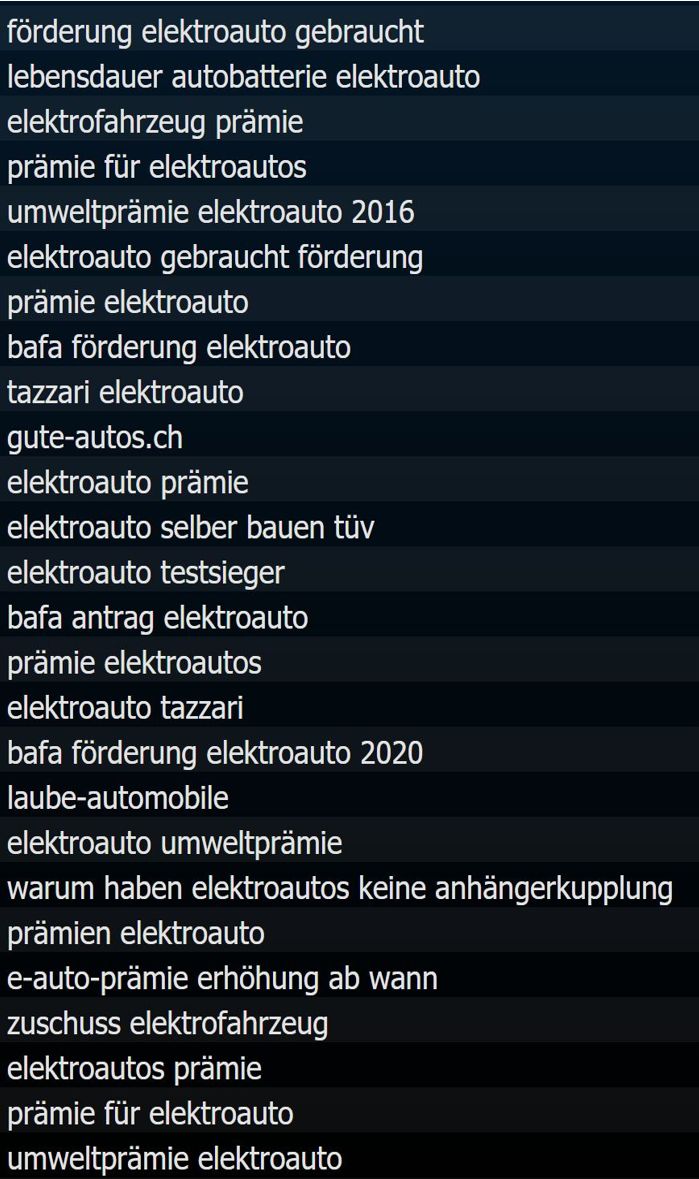
The six providers considered are therefore not at all prepared (so far) for the dominant future topic, which also becomes clear when looking at the terms ranked:

Source: rankanalyst.de

Repair portals are less likely to deal with financing and funding topics. However, since there is apparently no other content available that could cover other topics in demand, the pattern seen in the graphic above emerges: few rankings for less well-fitting topics, almost entirely in the bottom quarter (places 75 – 100).

The portals would therefore be advised to quickly build up relevant content. The demand for repair services for electric vehicles will certainly increase quickly and will then want to be satisfied.

Conclusion

With specialized tools such as RankAnalyst , Google’s treasure trove of data can be mined and used to analyze very precisely how closely one’s own offering matches demand. And, of course, how the competition is doing. The examples mentioned here show only a small fraction of what could be possible. Of course, this approach can also be used to uncover (revenue) potential that may not have been recognized so far, to prioritize one’s own offering with regard to the volume of demand, or to tailor the presentation/description of one’s own offering more precisely to user expectations.